Here's How It Works. In the template below we examine the paramaters specific to each fish. Each section gets assigned a point value based on things such as how the fish is caught or transported. The sum of the points is our Fishprint score.
| Passive gears are by far the most energy-efficient type of fishing, while bottom trawling is the most energy-intensive. There is an inverse correlation between fuel consumption per kg fish (fish-capture efficiency) and catch rate. Large catches and good availability of fish result naturally enough in good efficiency and low specific energy consumption, and vice versa. This is shown most clearly in the case of large trawlers, but is more diffuse in the other vessel groups. | |||||||||||||||||||
| Fishing Methods | |||||||||||||||||||
|---|---|---|---|---|---|---|---|---|---|---|---|---|---|---|---|---|---|---|---|
| Seiners | 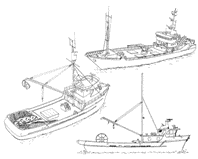 | Learn More | Seine nets are sometimes called surrounding nets. These nets use a variety of means to capture - from hand thrown to as many as four or five boats dragging the net around the harvest in the water, Seine nets typically do not drag the bottom so their effect on habitat of aquatic plant and shellfish is less than other methods. | ||||||||||||||||
| Gill Net | 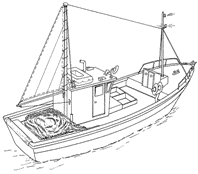 | Learn More | This is a straight line net which is dropped and often left overnight. The nets are efficient because the nets do not need steaming (or boat movement) to harvest. Thus this method inspires a better Carbon Fishprint rating. | ||||||||||||||||
| Trawlers | 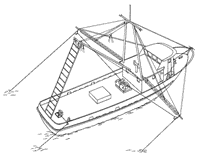 | Learn More | Trawlers are vessels which drag the net behind the boat, using fuel constantly during the harvest method. Some trawlers do drag the bottom so there is effect on aquatic plant and shellfish life. | ||||||||||||||||
| Hook and Line | 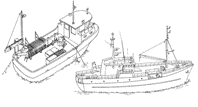 | Learn More | This method is used to catch larger fish - different methods are used with pole and line, some more efficient than others - carbon speaking that is! | ||||||||||||||||
| Dredgers |  | Learn More | Dredgers are cages or nets with steel bottoms which drag along the bottom of the ocean floor. Used mostly in shellfish harvesting, like Scallops and Lobsters and Clams, this method uses more energy to move the net along the bottom - the method also disturbs the ocean floor aquatic plant life, thus further effecting its Carbon Fishprint. | ||||||||||||||||
| Pots/Traps | 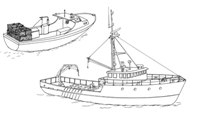 | Learn More | Pots and traps generally use the same method to capture their prey. Usually keeping traps and pots in a set or series of six to eight traps, the boat travels back and forth to get from one series to the next. Deeper ocean going vessels require larger carbon energy to operate and so their rating will be effected more by the distance to harvest than by the method. While the seiner will have the larger vessel stationary, the pot/trap method requires the vessel to always be traveling towards the next series - using fuel constantly in the process. | ||||||||||||||||
| Distance From Shore for Catch |  | The distance from shore is critical both for the obvious reason - the distance, but also because the farther a vessel travels, usually the larger the motor(s) required to get the vessel in position, thus the farther the travel to harvest, the more significant the carbon use. | |||||||||||||||||
| Special Carbon Usage or Savings |  | Sometimes for a specific fish or specific catch, there reasons for a change in the Carbon usage - this section allows for such change and reasons are detailed here: | |||||||||||||||||
| As far as Aquaculture is concerned, most studies indicate that embodied energy associated with feed inputs accounted for the largest proportion (approx. 60 to 80%) of industrial energy use, followed by direct energy usage (20 to 40%) and energy use in rearing the juvenile smolts stocked (10 to 20%). This might suggest that use of trimming could improve energy consumption in aquaculture by up to (50-60%) More recent estimates suggest lower overall energy consumption, indicating improved efficiency. | |||||||||||||||||||
| Aquaculture | |||||||||||||||||||
| Feed Conversion Ratio | 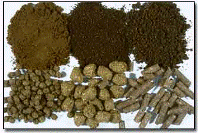 | The feed ratio is the amount of fish meal a fish must consume in order to add weight. This ratio is the quintessential component of a successful farm species. Some farms are better in these ratios because of the specific processes or methods. Species also have different metabolisms requiring more or less fish meal weight to get to a harvestable size. | |||||||||||||||||
| Direct Energy Use |  | This section is a review of the specific farm and the energy conservation methods they use. Some farms have their pens far from their processing center, causing an increase to the Carbon Energy necessary to bring to processing. Other farms are located far from transportation to market and thus use more carbon energy to bring their products to market. We try to evaluate each farmed product based on the producer efficiency. Extra credit is given for self generated energy and smart use of energy. | |||||||||||||||||
| Specific Farm Energy Use | 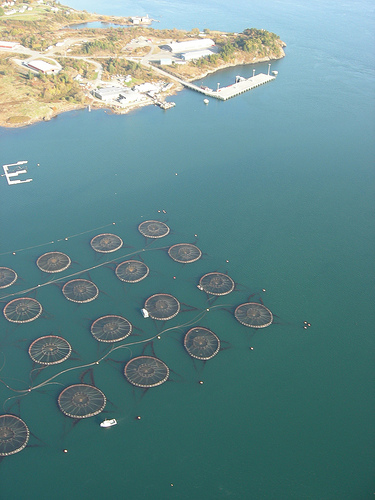 | The growing of smolts is an intense process. It requires a number of different energy uses, including special lighting, water temperature stability and inoculations – all have a energy component associated with their use. The OceanPro Fishprint takes the smolt production into consideration as a part of the scale to determine the amount of Carbon Energy required to bring a smolt to the farm. | |||||||||||||||||
| Another large use of Energy is the ability to bring the product to market. Depending on the locality of the source, this can be accomplished with many different methods - dependant on the condition of the source and distance to the customer. Included in the distribution is the use of the refrigerants and the energy to keep a product at proper temperatures, airplane or truck delivery - or any combination of such. Also included in this section is the efficiency of the distributor and the freight companies and their general practices. | |||||||||||||||||||
| Delivery | |||||||||||||||||||
| Delivery from Dock to Distributor | 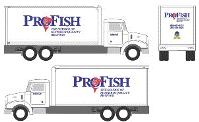 | This section measures the distance a fish must travel once it is landed. The fish can be either aquaculturally raised or harvested from the wild. In either case, once landed and processed for delivery, there is carbon energy necessary to bring a product to market. Some use air travel, some use rail and still others truck. Some, like aquaculture products from South America use a combination of both so their Carbon Fishprint is higher than one might have initially anticipated. | |||||||||||||||||
| Refrigerant Use | 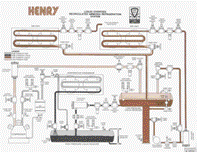 | Refrigeration is a mechanical process that uses energy to create lower temperatures. There are two proven methods - one straight mechanical and the gas based. The gas based (Ammonia) system used considerably less carbon energy to operate, and thus those processing and storage facilities that store using Ammonia based systems are better rated than the mechanical ones. | |||||||||||||||||
| Distributor Freight Efficiency | 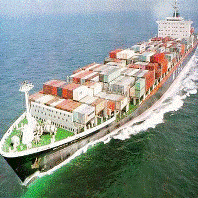 | Once a product is brought to market, a local distributor is used to deliver the product to the individual restaurant/foodservice unit. Distributors use different methods to store and transport their product. This section accounts for the use of energy at the distributor level. Some distributors are pro-active in their approach to energy use and therefore have a better rating than others. This section evaluates the local distributor. Carbon offset credits are available to be purchased by distributors - the monies paid for these offsets are used to help re-populate forests, prevent deforestation and add beneficially to the environment. | |||||||||||||||||
| Raw Material Shipping | 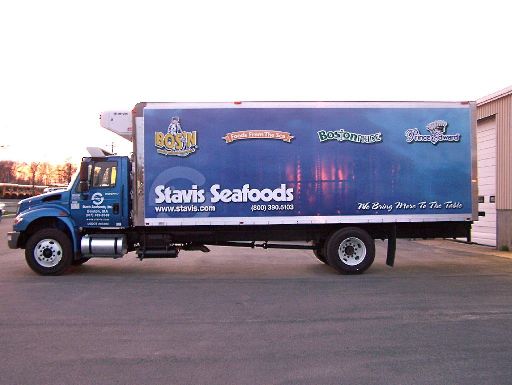 | Additonal raw material is required to make some products – that raw material must be brought to the processing center - this too requires some Carbon Energy output. The distance the product must travel to get to the processor is taken into consideration here. An example would be breading for the pre-breaded cod fillet - the breading is produced in midwest and shipped to processors on west coast . * Special requirements explained in notes section below. | |||||||||||||||||
| Freezing process | 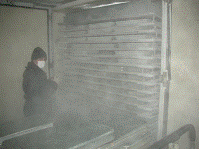 | Just as in storage, when processing a product, the method for cooling to final state is taken into consideration. Some use nitrogen tunnels, others use blast freezers and still others use the old fashion method of putting in a freezer that is below zero degrees. | |||||||||||||||||
| Processing plant Efficiency |  | The plant where products are further processed can have a good energy use plan - here credit is given if such a plan is proven and is in operation and points are added for those plants that antiquated and inefficient - from an energy point of view. | |||||||||||||||||
| Conversion processing | Some products take two steps to be market ready - a frozen smoked fish must be smoked, using energy in this step and must also be frozen, also using energy. Other products can have three steps, coating, cooking and freezing. This section adds points for those products with multiple processing steps. Each step, regardless of how minute consumes some carbon energy - we try to capture that fact here. | ||||||||||||||||||
| *Rating based on below evidence - amount manually entered | |||||||||||||||||||


